Details
Solution type
A good and interactive website is a helpful tool for exploring the energy situation in Europe. The Energy Interactive Webtools and GIS Maps Database collects useful web applications and interactive maps for the study of sustainable Energy Systems.
Some European-funded projects finish their research by developing a web application or an interactive map. For some others, the development of a web application or an interactive map is the main aim (e.g. Heat Roadmap Europe, Thermos, PLANHEAT. International organisations like ENREL or IRENA offer these kinds of internet-based calculators. The main aim of public and private organisations is that the end-user (Local or Federal Governments, Research Centres, Students, private companies, public organisations, etc.) will be able to use these tools to calculate or visualise specific variables of interest (eg. heat demand, CO2 emissions caused by a certain technology, solar irradiation in a specific city). Some of the Web-Apps do not calculate any variable but simply offer a wide range of data presented in a simple form.
The Energy Interactive Webtools and GIS Maps Database collects web applications and maps from many organisations around the world. Most of the applications are from European countries. The database is categorised into four main categories:
- Renewables & Electricity
- Heating and cooling
- Mobility & transport
- Emissions
The idea behind the database is to gather all tools available on the internet in one place, saving a great amount of time for the users.
The database is updated frequently.
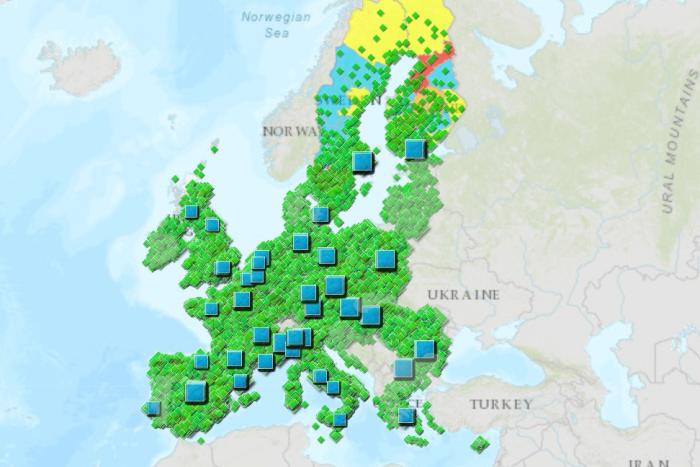
 Printscreen from The Energy Interactive Webtools and GIS Maps Database.
Web applications
A web application (web app) can be defined as a computer program which performs tasks over the internet. The way the web app operates can be summarised as follows: The user or client sends a request over the internet to a web server via the application’s user interface. The web server then forwards the request to the appropriate web application server and the latter performs the requested task and generates the results. The results come back, following the same path to the user as before.
A good example of a web app is the Wastewater Heating Potential web app, which estimates the heating potential that can be supplied using large-scale wastewater heat pumps in district heating systems. The web app is based on real heat pump plants which recover heat from wastewater treatment plants, as well as on heat potential studies. The WWHP web app is based on our own website towards 100 renewables. This allows the web app to be accessed from anywhere without cost.
 The Pan-European Thermal Atlas, is one of the GIS map tools from the database.
Interactive maps
An interactive map is a GIS-based map on a website whose main aim is to show a resource or technology available in a certain location (e.g. a city, region or country). It allows the user to interact with the interface to see one or more technology/resource available at a certain time (or overall). Each map offers different features - like eg. pop-up boxes - which show information about the selected region or city.
An example of this is the Thermal Energy Storage Map. It shows the user all thermal energy projects within Europe. Another interactive map is the Heat Road Map Europe, which has the main objective to show the district heating potential in several European cities. It also shows the excess heat that can be integrated into the cities' heating networks.
Aldo Pérez, mail
References:
- What is a Web Application? MaxCDNONE