Introduction
The Smart Cities Marketplace is collecting self-reported data from EU-funded projects and provides data insights by offering various visualisations. All data captured is available for download and further analysis via this page.
The information reported will provide stakeholders with information that is monitored under real conditions, allowing them to obtain first-hand information to foster replication.
Background information on data definitions can be found as part of the smart city project monitoring guidance provided here.
Self-reported data per project
The data can be inspected per project using dedicated visualisations. Filtering options such as project name, KPI, city and technology are available.
Trends in self-reported data
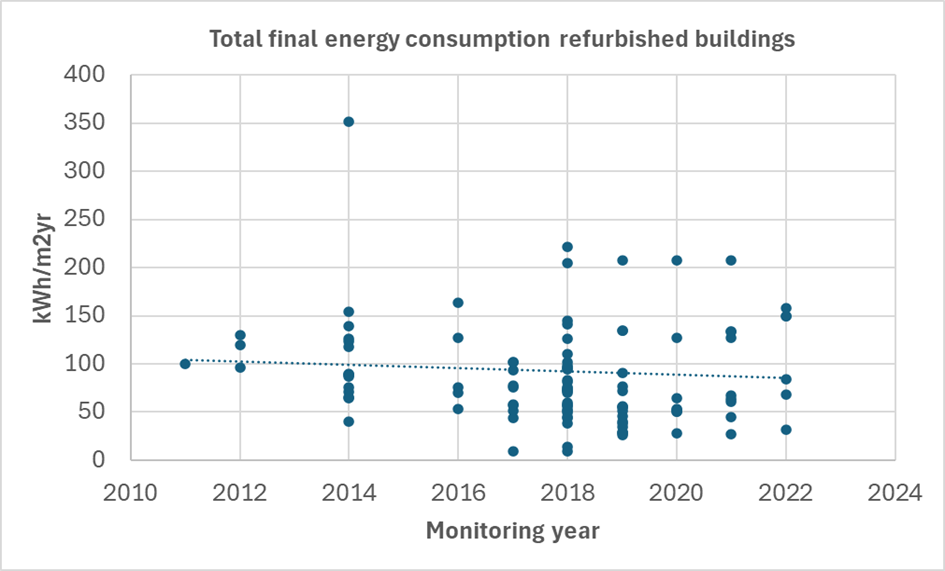
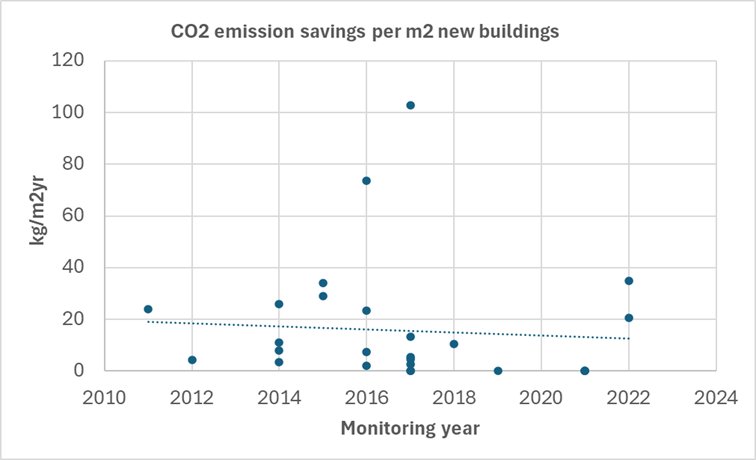
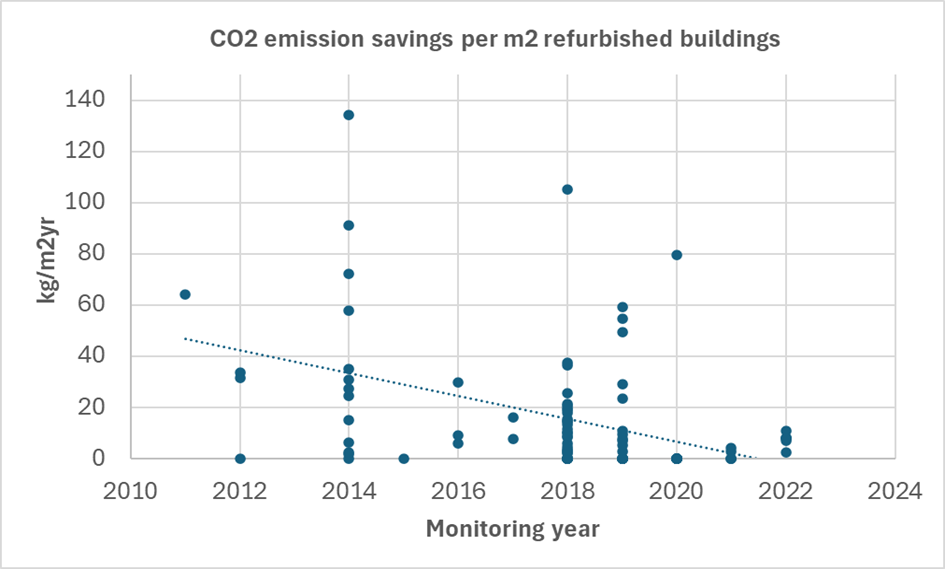
Between 2010 and 2022, the data captured via the Smart Cities Marketplace self-reporting tool shows some trends, sometimes clear, frequently not so clear. Possible causes are that, over time, the focus of the awarded projects changes from work programme to work programme and that the portfolio of the demonstration buildings (residential, tertiary or industrial) is variable:
Energy consumption with renewable energy taken into account (this means that, after subtraction of the local renewable energy, the net energy consumption of buildings is less than shown here. (Final energy reflects mainly the building quality (insulation, glazing etc.):

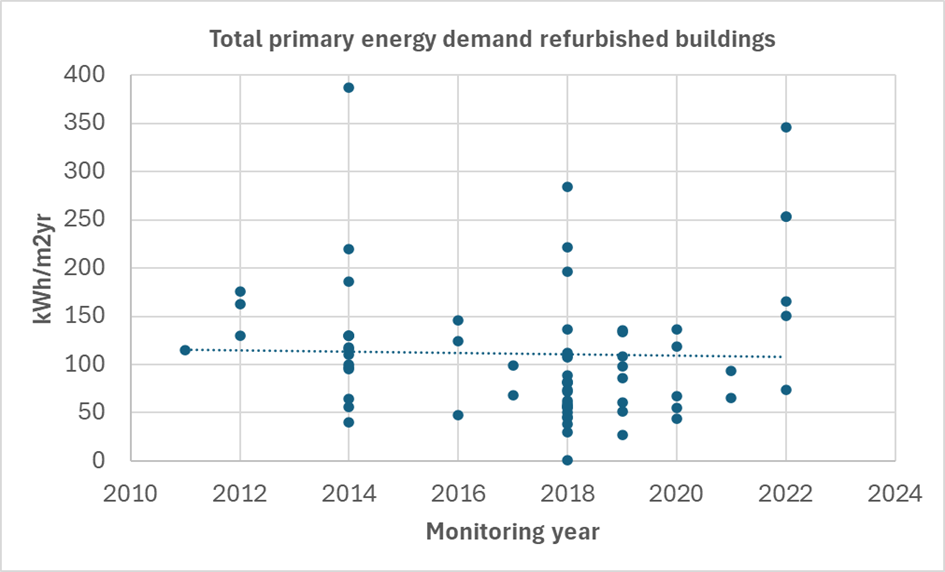
Primary energy demand

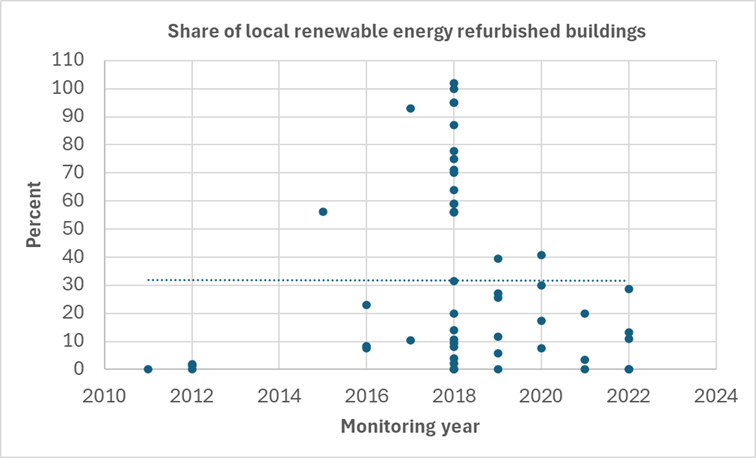
Share of local renewable energy

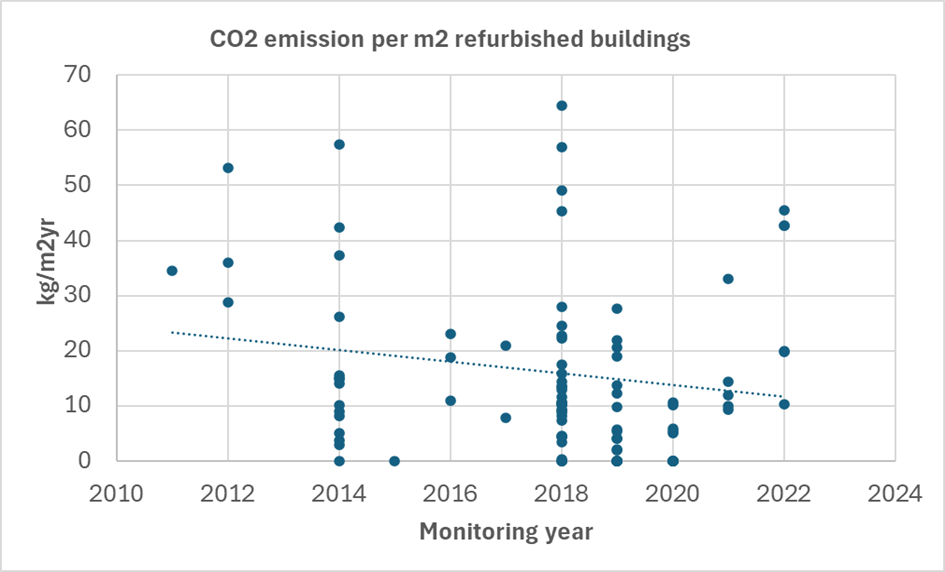
CO2 reduction per m2 of buildings: CO2 emission

CO2 reduction per m2 of buildings: savings
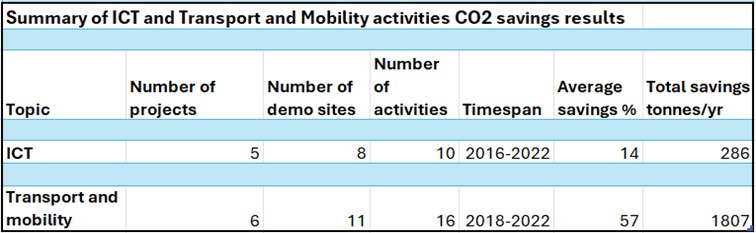
For data related to projects in ICT and Transport and Mobility, for which so far data have only been collected over a short timespan, a summary table is shown below.
Aggregated KPIs
The top graph shows the total amount of square meters of buildings that have been built/refurbished within the scope of the various programmes of the European Commission monitored through the Smart Cities Marketplace. The figures are subdivided in the amount of m2 for new buildings, refurbished buildings or buildings as part of a Positive Energy District.
The graph on CO2 emissions shows the annual savings of all projects combined that have reported their data, subdivided in the categories ICT, new buildings, refurbished buildings, Positive Energy Districts, mobility and energy systems. For refurbished buildings, energy systems, ICT and mobility the savings are the difference with respect to the situation before the intervention (savings positive if the intervention results in lower emissions) . For new buildings the savings are with respect to the applicable building code. For Positive Energy Districts the savings are with respect to zero emission (negative savings if the emission is still positive).